Tuesday 17 April, 2007, 15:58 - Amateur Radio
Posted by Administrator
Posted by Administrator
 These days, a lot of radio planning (broadcasting and cellular for example) relies heavily on the ability to use computers to predict coverage from a site. So Wireless Waffle thought it would prove an interesting exercise to do some coverage predictions from a known radio station and compare them with actual reception. It's probably worth adding that using a single receive antenna in a fixed location for comparison isn't necessarily fair - reflections could mean that there are strong nulls in a particular direction, though with the antenna mounted nice and high and above most nearby obstacles these effects are minimised.
The prediction tool used is RadioMobile, which is a freeware tool designed for radio amateurs and does pretty good VHF and UHF predictions as well as path profiles which can be used to hazard a guess at microwave links too. The 70 centimetre amateur band was used as the test case and the signals from various neighbouring repeaters as the benchmark. Most repeaters have decently sited antennas at a reasonable height and free of local obstructions and so should make for a reasonably accurate prediction.
First off, a scan around the 70cm (433 MHz) band on a day when propagation is flat was conducted, to see which repeaters could be heard and what strength they were. Here's the list (channels not listed are ones on which nothing was heard):
RB0 GB3BN S9+ (Bracknell)
RB1 GB3BV S3 (Hemel Hempstead)
RB2 GB3LV S1 (Ealing)
RB3 GB3HL S9+ (Hillingdon)
RB6 GB3LW S3 (Central London)
RB7 GB3HZ S9+ (Amersham)
RB12 GB3GF S9+ (Guildford)
RB13 GB3VH S3 (Welwyn Garden City)
RB14 GB3HR S9+ (Harrow)
RB15 GB3FN S9+ (Farnham)
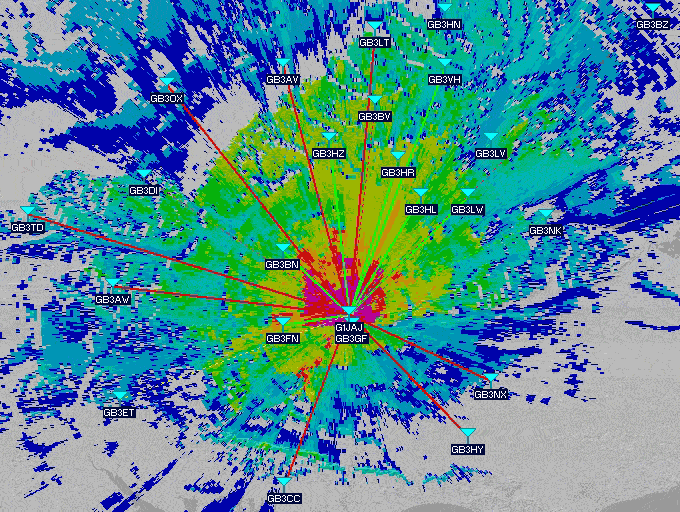
 So the question is, could a computer prediction reproduce this set of results? The parameters of the station plus those of all the nearby repeaters (including those that are nearby but which weren't received) were entered into RadioMobile and a plot produced. The results are shown on the right (click to see the full size version).
The easiest way to see what the results show is to look at the colour of the line between the amateur station used and the various repeaters. A solid red line indicates that the prediction shows there to be no possibility of a signal getting through; yellow indicates that reception would be on the fringes of possibility and green indicates that all should be OK. A dotted line shows that the prediction is borderline between two possible outcomes. So here's what the prediction says (ignoring all those which are purely red and thus should be inaudible):
RB0 GB3BN Green
RB1 GB3BV Dotted Red
RB2 GB3LV Dotted Green
RB3 GB3HL Green
RB4 GB3NK Dotted Green
RB6 GB3LW Green
RB6 GB3DI Dotted Red
RB7 GB3Hz Green
RB11 GB3HN Dotted Green
RB12 GB3GF Green
RB13 GB3VH Green
RB13 GB3ET Dotted Yellow
RB14 GB3HR Green
RB15 GB3FN Green
A number of predictions have been highlighted in bold as these are at variance with what was borne out in practice. It seems there are 4 other repeaters which should be audible that aren't. Also, GB3BV is shown as very marginal on the prediction yet is a reasonably good signal. However, the prediction has correctly identified approximately the correct likelihood of reception for 9 of the original 10 repeaters being received.
So are predictions any good? From the results shown here, they're not bad, however the relatively simple predictions produced by RadioMobile are probably insufficiently complex to take account of other factors that play a major role in radio propagation such as clutter from trees and buildings. Nonetheless, not a bad result and an interesting illustration of the power of computers.
add comment
( 1494 views )
| permalink
| 


 ( 3 / 12082 )


 ( 3 / 12082 )

