
Summer Station Successes
With the summer Sporadic-E season now all but over, it's time to reflect on the achievements made. By my reckoning nearly 200 new logs have been added to the Wireless Waffle FM DX Logbook more than doubling the number previously recorded. Amongst these are 10 new countries: Austria, Czechia, Estonia, Finland, Hungary, Libya, Poland, Romania, Serbia and Slovakia. Reception of 'Dar Al-Iftaa' (also found online named as 'Dar Al-Ifta' and 'Ifta FM') from a transmitter site at Gharyan (a.k.a. Garyan) in Libya becoming my all time Sporadic-E distance record of 2435 km.
In another seasonal surprise, 18 August 2025 yielded some incredible Tropospheric propagation across the North Sea bringing in reception from Denmark (with full RDS being received) and Sweden, the latter coming in at 1146 km beating my former Tropo distance record of 675 km - almost twice as far. All these new logs have significantly fuelled the analysis of the different propagation modes which can be found on the logbook.
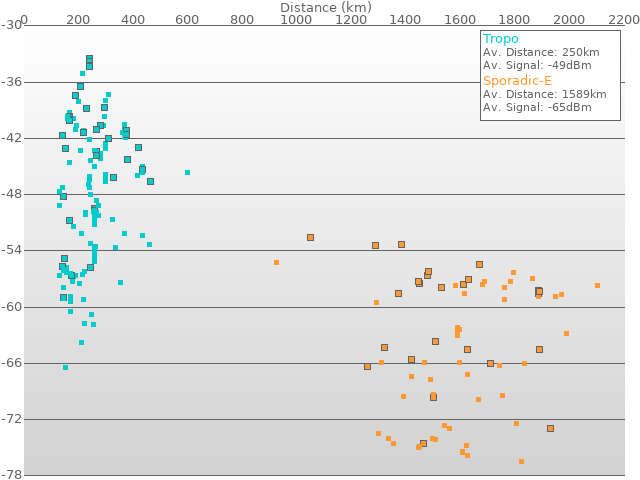
The original analysis chart (above) compares the signal that would be received based on simple free-space propagation loss for the various stations received. As of today it shows that the average 'received signal' for Tropospheric propagation is -51 dBm and for Sporadic-E is -67 dBm. This would suggest that Sporadic-E yields 16 dB lower path loss than for Tropospheric propagation, given that the threshold for reception of a signal is the same no matter what route it takes between transmitter and receiver.
You may note that some of the squares on the chart which represent a log entry have a pale grey square around them. This reflects the fact that the station's RDS was received. It takes at least 20 dB more signal for a receiver to decode RDS than it does just to hear the audio so the expectation was that the logs where RDS was successfully received would be clustered around those with the highest signal strength. For the Tropospheric logs this logic generally holds with the most RDS logs being those whose free-space signal would be over -46 dBm. For Sporadic-E however, the RDS from even some of the theoretically weakest stations was successfully received.
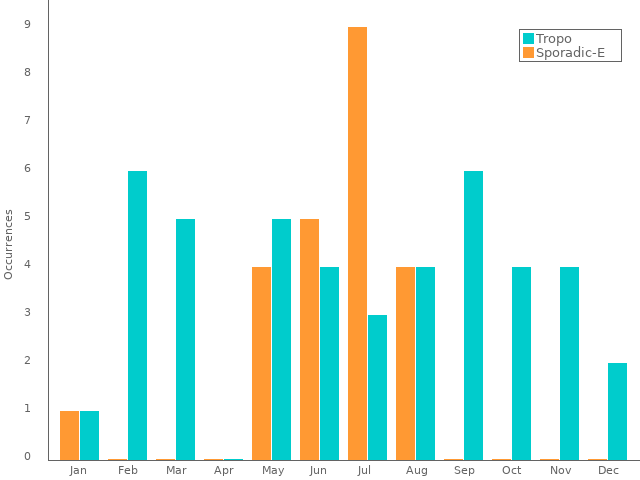
The second chart looks at the months in which different propagation modes occur. In general Tropospheric propagation is spread evenly across the whole year with Sporadic-E occurring in the summer months (primarily June, July and August) with a little spurt of activity in mid-winter (January). This supports generally perceived wisdom on the matter.
Two new charts have been added to the page. The first shows the distribution of logs across the FM band from 87.5 to 108.0 MHz with stations being grouped into blocks 1.7 MHz wide. Sporadic-E openings generally begin from low frequencies and work their way up the band, occasionally reaching well above the FM band and impacting the 2m amateur band (144 MHz). This analysis clearly shows that the reception of Sporadic-E signals is much more prevalent at the bottom of the FM band, whereas in general the likelihood of Tropospheric propagation is relatively equal across the whole band.

It may look as if there is less reception of Tropospheric signals in the top 'block' between 106.2 and 108.0 MHz. However, it is worth noting that in most European countries, the power levels of stations in this frequency range (especially above 107 MHz) is limited so as to try and avoid causing unwanted interference to aeronautical radio services which occupy the territory above 108 MHz. It is therefore more difficult to catch DX stations above 107 MHz as their power levels are lower and this is most likely why this frequency range appears to have fewer logs than others.

The final new chart plots the frequency on which a station has been received against its distance. The idea was to discover whether there is any correlation between the two. For the Tropospheric logs where the average distance is 292 km, the line-of-best fit which is also shown on the chart tilts slightly down at higher frequencies but is otherwise quite flat suggesting that propagation right across the FM band is pretty evenly spread (noting the earlier comment about the transmitter power of stations above 107 MHz). For Sporadic-E propagation where the average distance is 1554 km, there does seem to be a slight tilt downwards at higher frequencies however as there are fewer logs at higher frequencies, this could account for this difference. Also, it is clear that the spread of distances shown in the logs is significant so trying to a 'best fit' line may have less relevance. In general and subject to even more data, there's nothing that is yet totally conclusive when it comes to Sporadic-E propagation providing reception of more distant stations at lower frequencies.
In another seasonal surprise, 18 August 2025 yielded some incredible Tropospheric propagation across the North Sea bringing in reception from Denmark (with full RDS being received) and Sweden, the latter coming in at 1146 km beating my former Tropo distance record of 675 km - almost twice as far. All these new logs have significantly fuelled the analysis of the different propagation modes which can be found on the logbook.
;)
The original analysis chart (above) compares the signal that would be received based on simple free-space propagation loss for the various stations received. As of today it shows that the average 'received signal' for Tropospheric propagation is -51 dBm and for Sporadic-E is -67 dBm. This would suggest that Sporadic-E yields 16 dB lower path loss than for Tropospheric propagation, given that the threshold for reception of a signal is the same no matter what route it takes between transmitter and receiver.
You may note that some of the squares on the chart which represent a log entry have a pale grey square around them. This reflects the fact that the station's RDS was received. It takes at least 20 dB more signal for a receiver to decode RDS than it does just to hear the audio so the expectation was that the logs where RDS was successfully received would be clustered around those with the highest signal strength. For the Tropospheric logs this logic generally holds with the most RDS logs being those whose free-space signal would be over -46 dBm. For Sporadic-E however, the RDS from even some of the theoretically weakest stations was successfully received.
;)
The second chart looks at the months in which different propagation modes occur. In general Tropospheric propagation is spread evenly across the whole year with Sporadic-E occurring in the summer months (primarily June, July and August) with a little spurt of activity in mid-winter (January). This supports generally perceived wisdom on the matter.
Two new charts have been added to the page. The first shows the distribution of logs across the FM band from 87.5 to 108.0 MHz with stations being grouped into blocks 1.7 MHz wide. Sporadic-E openings generally begin from low frequencies and work their way up the band, occasionally reaching well above the FM band and impacting the 2m amateur band (144 MHz). This analysis clearly shows that the reception of Sporadic-E signals is much more prevalent at the bottom of the FM band, whereas in general the likelihood of Tropospheric propagation is relatively equal across the whole band.
;)
It may look as if there is less reception of Tropospheric signals in the top 'block' between 106.2 and 108.0 MHz. However, it is worth noting that in most European countries, the power levels of stations in this frequency range (especially above 107 MHz) is limited so as to try and avoid causing unwanted interference to aeronautical radio services which occupy the territory above 108 MHz. It is therefore more difficult to catch DX stations above 107 MHz as their power levels are lower and this is most likely why this frequency range appears to have fewer logs than others.
;)
The final new chart plots the frequency on which a station has been received against its distance. The idea was to discover whether there is any correlation between the two. For the Tropospheric logs where the average distance is 292 km, the line-of-best fit which is also shown on the chart tilts slightly down at higher frequencies but is otherwise quite flat suggesting that propagation right across the FM band is pretty evenly spread (noting the earlier comment about the transmitter power of stations above 107 MHz). For Sporadic-E propagation where the average distance is 1554 km, there does seem to be a slight tilt downwards at higher frequencies however as there are fewer logs at higher frequencies, this could account for this difference. Also, it is clear that the spread of distances shown in the logs is significant so trying to a 'best fit' line may have less relevance. In general and subject to even more data, there's nothing that is yet totally conclusive when it comes to Sporadic-E propagation providing reception of more distant stations at lower frequencies.
add comment
( 893 views )
| permalink
| 
 ( 3.2 / 1871 )
( 3.2 / 1871 )
A PHP Rant
Wednesday 20 August, 2025, 14:11 - Much Ado About Nothing
Posted by Administrator
Posted by Administrator
 Wireless Waffle has been publishing material now for 20 years. However you may have noticed that there was a large hiatus in new content between October 2023 and August 2025. This black hole was not caused by the gravitational collapse of a dying star, but instead by the fact that the web-server on which the site is hosted updated 'PHP' (the programming language on which the site is based) from version 7 to version 8.
 Like many programming languages, PHP evolves from time to time. Some functions are added, others are deprecated and some just function slightly differently (for example, throwing an error if they are given a number as text variable rather than as a pure number). What's galling about the changes to PHP however is that they don't just deprecate functions (which in many other programming languages allows them to continue to function whilst whispering a hushed error that you really should think about using a newer one), but they remove them, change the syntax and generally johnny around with things so that code that was working perfectly well before now throws up a litany of errors longer than the list of resistors for sale in a 1980s Tandy catalogue.
Where you have written code yourself, it's generally not so difficult to understand what's changed and modify it to behave correctly with updated language versions: for example adding (int)$... in front of a number that has been derived from a text variable. But when you have complicated software that someone else has originally written, such as the blogging platform used for Wireless Waffle, and when that project has stopped being developed by the original author, tracking down every error to try and get it working again after a language upgrade can prove more of a nuisance than a mosquito trapped in the microphone of a megaphone.
As it stands, the majority of errors on the blogging platform used by Wireless Waffle have now been corrected, however there remains a problem with submitting new articles (or editing old ones) to the extent that new articles are now having to be written as text files in 'notepad' and uploaded to the server manually. It's a work-around that's far from satisfactory, but at least it means new content can finally be published.
As a contrast to PHP, some JavaScript last updated 19 years ago (the code which animates the text below the Wireless Waffle logo at the top of the page) still runs perfectly despite similar upgrades having been made to the underlying programming language. To those in charge of PHP, I cry 'shame on you' for making the lives of coders unnecessarily complicated. A proposal: write a tool (maybe in JavaScript so it keeps working) in which code from a previous version of the programming language can be pasted, and it will automatically update it to be compliant with a new version. That, or stop making changes that render older code inoperable.

Is Amateur Radio a Waste of Space?
Friday 15 August, 2025, 15:39 - Amateur Radio, Spectrum Management, Much Ado About Nothing
Posted by Administrator
One of the wonderful things about waterfall displays on Software Defined Radios (SDR) which show (over a period of time) which radio frequencies are being used, is that they allow you to see which frequencies are busy and which are not.Posted by Administrator
During a recent period during which propagation in the HF bands was reaching frequencies well above 30 MHz, Wireless Waffle was watching the waterfall for transmissions in the amateur radio 10 metre band (28.0 - 29.7 MHz). The frequency range being shown on the screen ranged from just below 26.5 MHz to just above the top end of the 10 metre band. Included in this frequency range are a number of Citizens Band (CB) radio frequencies, in particular the range from 26.965 MHz to 27.405 MHz where the standard 40 channels can be found, as well as frequencies above and below this which though (in most countries) are illegal to use, do get used and are known as 'freeband' channels.
The screenshot below shows what could be seen, with the frequency range of the different services (and other things of note) shown overlayed on top.
;)
What becomes immediately apparent is the difference in the level of usage of the CB frequencies, and those of the 10 metre radio amateur band. Even the CB freeband frequencies have as much, if not more, visible activity than the 10 metre band. There is even a CB transmission taking place on top of an over-the-horizon radar (OTHR) signal. Within the 10 metre band, the frequency used for digital mode FT8 (28.074 MHz) is by far the busiest. There are also a number of voice (SSB) exchanges taking place between around 28.3 and 28.6 MHz (noting that the SSB portion of the band extends to 29.0 MHz). The rest of the band is largely empty. Even the FM channels (29.52 - 29.7 MHz) only show a couple of weak carriers.
Let's put this into context. Radio Amateurs have been assigned 1.7 MHz in total of fertile spectrum for their personal experimentation and communication (this spectrum is not shared with anyone else), yet large swathes of it remain as barren the Atacama. Conversely, CBers have been crammed into 0.44 MHz of industrial wasteland (which is shared with ISM devices, government use and more) which is so busy that they have burst the banks and illegally occupied gardens in the neighbourhood.
In the UK, CB breakers have access to 80 channels, the 40 international ones mentioned above, as well as a UK-only set of channels from 27.60125 to 27.99125 (known as CB 27/81 as it was introduced in 1981). The UK-only CB 27/81 channels, it is fair to say, remain rather underused, perhaps more-so than the 10 metre band suggesting perhaps that CB radio usage in the UK is not the source of the heavy usage. Germany, Czechia, Slovakia and Hungary have an additional 40 channels running from 26.565 - 26.955 MHz (immediately below the standard 40 international channels) and this range of frequencies is relatively busy. Some countries are also legally permitted to use a wider range of frequencies, though much of the freeband usage is not from these countries. There is a good list of the various CB frequencies around the world on the HF Underground site.
Radio Amateurs get mightily upset if anyone encroaches on their frequencies, especially if those users are not meant to be there. The International Amateur Radio Union (IARU) monitoring system newsletter is replete with reports of illegal CB use in the 10 metre band.
Far be it for Wireless Waffle to suggest that frequencies could be taken away from Radio Amateurs to give to CB enthusiasts, but the old adage of 'use it or lose it' has never seemed more apt.
Is V2X the next MT FESTERS?
Thursday 26 October, 2023, 14:52
Posted by Administrator
MT FESTERS is not, as you might at first have thought, an elevated stone protuberance in the world of the Munsters. It is simply an anagram of the acronyms ERMES and TFTS.Posted by Administrator
 ERMES was a European Paging system. In the early 1990s, at a time when paging was taking off, the European Union issued a directive (90/544/EEC) which forced all EU Member States to set aside the frequency range 169.4 - 169.8 MHz for paging services. Ultimately text messaging using SMS came along at the same time and made paging obsolete before any EU-wide services were introduced. Fifteen years later, in 2005 the directive was repealed.
- TFTS was the terrestrial flight telecommunications service. The European Radiocommunications Committee set aside 1670 - 1675 and and 1800 - 1805 MHz for TFTS in 1992 (ERC Decision (92)01). TFTS was meant to be a network of ground based transmitters which would provide voice and basic data connectivity to aircraft. This decision was withdrawn ten years later in 2002 when no networks whatsoever had been rolled-out and satellite communication for aircraft had become easier and far less expensive.
Arguably the same thing is now happening with V2X technologies. V2X (Vehicle to Everything, sometimes also known as ITS, intelligent transport systems) represents a number of different solutions for connection to, and between, road vehicles to enhance road safety and improve driverless driving. Many countries around the world (including the USA, Japan and Europe) set aside 75 MHz of spectrum from 5850 - 5925 MHz for this purpose (as per ITU Recommendation M.2121). However in 2020, the FCC reduced the amount of spectrum available from the original 75 MHz, to just 30 MHz citing the availablity of other technologies such as radar, lidar and video cameras as delivering many of the safety-related capabilities that V2X was intended to provide. Japan has recently done likewise.
In Europe, CEPT has recommended 5855 - 5925 MHz for V2X/ITS technologies (ECC/REC/(08)01), and harmoinsed the use of the frequency range 5875 - 5925 MHz whereas the European Commission has harmonised only the frequency range 5875 - 5905 MHz (Commission Decision 2008/671/EC). Even the specification for the technology (ETSI EN 302 571) hedges its bets on which piece of spectrum will or could be used for this technology.
Notwithstanding all this, and the fact that the spectrum has been available for 15 years, there has been little to no take-up of the technology. The C-Roads initiative shows (on the 'implemented services' page) the extent of coverage of V2X equipped roads. With the exception of one or two highways, most deployments are city based experiments. The fact that the technology is yet to become standard in new vehicles is leading to classic 'chicken and egg' situation where manufacturers are reluctant to put the technology in cars because there is nothing for them to connect to, and highways agencies are reluctant to install any roadside infrastructure as vehicles are not equipped with it. Furthermore, there is confusion about the business model for the roadside equipment. Is this a safety responsibility of the road authorities, or could it be a commercial provider offering advanced weather and traffic reports who builds it out?

Alongside this confusion, 5G mobile technology is slowly being rolled-out and has the capability to provide the kind of connectivity between vehicles and the roadside that V2X/ITS promises (and the business model is clear). Equally, in-car radars now have the ability to communicate with neighbouring vehicles to provide information on when the driver is applying the breaks, for example. The case for V2X/ITS is therefore rather nebulous and it seems ever more likely that the spectrum set-aside for that purpose will fester for a few more years before pressure mounts and it is decided that V2X, like ERMES and TFTS has evaporated into nothingness.
What the spectrum could then be used for is a question for another day, however one option may be CBTC (communication based train control) which often uses unlicensed 2.4 and 5.8 GHz frequencies and could do with a 'safer' home given it is used to control the movement of (mostly metro) trains. China is considering the possible use of the frequency range 1785 - 1805 MHz for CBTC which, if you've been following this article, you will realise includes some of the original TFTS spectrum. And thus the circle is squared.