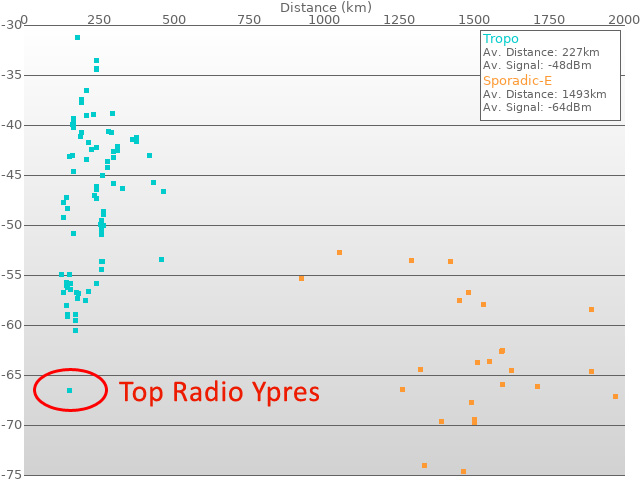
The Wireless Waffle FM DX Logbook has been updated to automatically calculate the theoretical signal levels, following a previous article that discussed whether any conclusions could be drawn about whether sporadic-E and tropospheric propagation produced different path losses. As a result of the update, the logbook page now draws the chart which shows the theoretical signal level produced by different transmitters.

With all of the logs now included in the calculations, the difference in propagation loss is smaller than that which was original posited, however it shows that the theoretical average signal from a radio station received via tropospheric propagation is around -48 dBm, whereas one received via sporadic-E propagation is around -64 dBm, a still not insubstantial 16 dB difference, suggesting that tropo propagation is more lossy than sporadic-E (as the received signal strengths are very similar).
What also stands out from the chart is the single outlying value in the blue, tropospheric values. One dot exists at around -66 dBm which is over 6dB lower than for any other station. This dot represents the theoretical signal from TOP Radio, from its 105.7 MHz FM transmitter in Ypres (Belgium), which has a supposed transmitter power (according to FM Scan, and the ITU GE06 database) of 100 Watts. This station has been logged on more than one occasion so it is not just a one-off freak of reception that it appears on the chart.
There are several possible explanations for the anomoly:
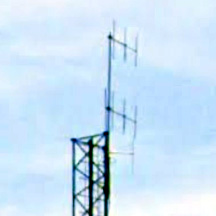
 It is not easy to see from the picture above and to the right, however using Google Street View it is possible to get a side look at the mast. Mounted on top are two, three element, vertically polarised antennas pointing roughly north west (as they would need to, to provide coverage in Ypres from the transmitter site). Again, it is difficult to tell, but a working assumption might be that these are the antennas used for TOP Radio, not least as they are the only ones that would be near the 30 metre height that the records suggest that they should be mounted at. It may be that the '100 Watt' power restriction has been interpreted as 100 Watts to the antenna, rather than 100 Watts e.i.r.p.
If we presume that:
If the e.i.r.p. of TOP Radio is closer to 800 Watts than 100 Watts, this would account for the anomoly in the received signal chart, and so the mystery is, at least partially, solved. Let's just hope that the authorities in Belgium responsible for regulating FM radio transmitters don't read this!

With all of the logs now included in the calculations, the difference in propagation loss is smaller than that which was original posited, however it shows that the theoretical average signal from a radio station received via tropospheric propagation is around -48 dBm, whereas one received via sporadic-E propagation is around -64 dBm, a still not insubstantial 16 dB difference, suggesting that tropo propagation is more lossy than sporadic-E (as the received signal strengths are very similar).
What also stands out from the chart is the single outlying value in the blue, tropospheric values. One dot exists at around -66 dBm which is over 6dB lower than for any other station. This dot represents the theoretical signal from TOP Radio, from its 105.7 MHz FM transmitter in Ypres (Belgium), which has a supposed transmitter power (according to FM Scan, and the ITU GE06 database) of 100 Watts. This station has been logged on more than one occasion so it is not just a one-off freak of reception that it appears on the chart.
There are several possible explanations for the anomoly:
- The transmitter site is at a particularly elevated location, improving the coverage of the station. However, according to various sources it is only 40 to 43 metres above sea level, which isn't particularly high.
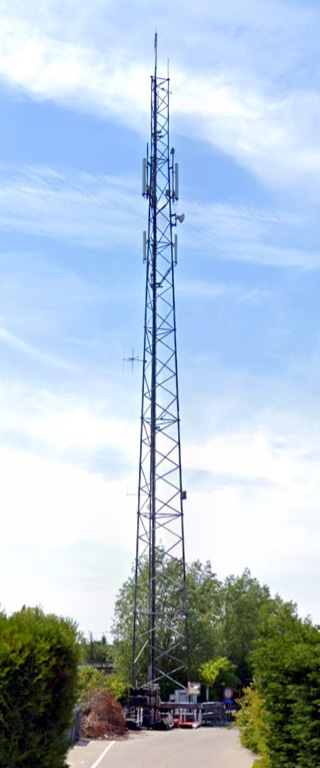
- The antenna is mounted very high above the ground. Again, according to FM Scan, it is only 30 metres above ground level, which isn't an outstanding lofty height, as the picture on the right of the transmitter site shows.
- The transmitter power is not the stated 100 Watts. For the 'dot' on the chart to be better grouped with the other stations received, the transmitter power would have to be at least 6dB higher, i.e. 400 Watts, or even higher.
- There is some freak propagation path from Ypres to the UK that occurs on regular occasions, and to different UK receive locations, which gives TOP Radio an advantage over other stations in its neighbourhood.
- There is an alien spacecraft hovering mid way between the UK and Belgium which is reflecting or relaying the signal with surprising effectiveness.
 It is not easy to see from the picture above and to the right, however using Google Street View it is possible to get a side look at the mast. Mounted on top are two, three element, vertically polarised antennas pointing roughly north west (as they would need to, to provide coverage in Ypres from the transmitter site). Again, it is difficult to tell, but a working assumption might be that these are the antennas used for TOP Radio, not least as they are the only ones that would be near the 30 metre height that the records suggest that they should be mounted at. It may be that the '100 Watt' power restriction has been interpreted as 100 Watts to the antenna, rather than 100 Watts e.i.r.p.
If we presume that:
- 100 Watts is being fed up the coax to the antennas; and
- the gain of each 3 element antenna is 6 dB relative to a dipole (a reasonable figure); and
- the additional gain from stacking 2 dipoles is 3 dB;
If the e.i.r.p. of TOP Radio is closer to 800 Watts than 100 Watts, this would account for the anomoly in the received signal chart, and so the mystery is, at least partially, solved. Let's just hope that the authorities in Belgium responsible for regulating FM radio transmitters don't read this!
add comment
( 326 views )
| permalink
| 


 ( 2.6 / 1720 )


 ( 2.6 / 1720 )


