
Reading Ionograms
Thursday 13 January, 2011, 04:22 - Spectrum Management
Posted by Administrator
Previously on Wireless Waffle we have discussed ways of checking and even gaining some knowledge of the state of propagation of the short-wave bands. But for truly advanced users, there is a way to find out the actual state of propagation for a particular location in real time. Scattered around the world are a series of ionosondes. These ionosondes are rather like radars in that they transmit a signal to the ionosphere and measure the time taken to get a response. They do this across a range of short-wave frequencies.Posted by Administrator
The result is a chart called an ionogram. An ionogram is effectively a radar picture of the height of the ionosphere at the location immediately above the ionosonde as well as providing an indication of its refractivity, over a range of frequencies. An example ionogram taken from the ionosonde in Dourbes, Belgium, is shown below.
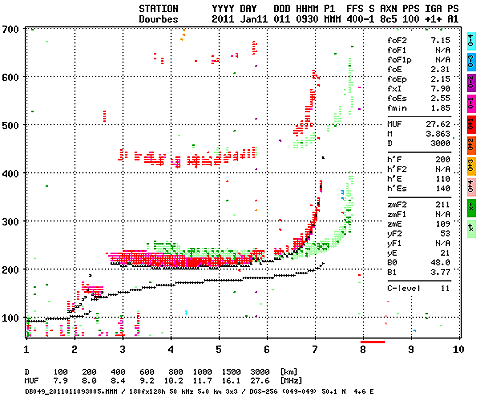
The ionogram is the ultimate way of assessing short-wave propagation. It tells us exactly what is going on. To help interpret the ionogram, there are also a useful set of figures provided in the diagram which give us some very useful information. So... how do we interpret the ionogram to help understand HF propagation?
In the ionogram above, the strong red/pink line extending from just below 3 MHz to just above 6 MHz shows that the ionosphere above Belgium was refracting radio signals in that frequency range straight back down again (ie at an angle of 180 degrees) - it was acting like a mirror for radio frequencies in this range. As the frequency goes above 6 MHz, the line bends upwards until eventually it goes off the top of the chart. This is the point at which the ionosphere stops refracting signals back down (at 180 degrees), however it will continue to refract signals at higher frequencies which hit it at lower angles (less than 180 degrees).
From this simple data, together with the height of the ionosphere (the scale up the left hand side of the chart) it is possible to calculate a number of very useful figures, and this is done for us.
Firstly, we have the maximum usable frequency (MUF). This is shown amongst the figures to the top right of the chart (in this case 27.62 MHz) and is also repeated at the bottom of the chart (under the label 3000 km). The MUF is the highest frequency which the ionosphere will reliably reflect radio signals. It is also the one which has the lowest refraction angle. What this means is that signals at this frequency will be refracted by the ionosphere (above Belgium in this case) but only where the path between the ends of the link hits it at a low angle, which equates to a path length of around 3000 km. Two stations, each 1500 km away from Belgium, the centre of whose path is above Belgium, will therefore be able to communicate at a frequency of 27.6 MHz. So a station in Western Ireland and one in Romania are likely to be able to communicate on this frequency. Equally one in Spain and one in Sweden might too.
The second useful frequency shown is the one shown as 'foF2' in the diagram (top right). In this example foF2 is 7.15 MHz. foF2 is the highest frequency at which the ionosphere above Belgium will refract signals at an angle of 180 degrees, ie straight back down. If you therefore want to communicate from somewhere in Belgium, to the same place in Belgium, using the ionosphere, this is the highest frequency I can use. How useful! But the best bit is the interpolations between foF2 and the MUF. These are the figures shown at the bottom of the chart under the various distances (from 100 km to 3000 km). These are the maximum frequencies I can use to communicate over the distance shown.
In this example, if my path length is 100 km, the highest frequency I can use is 7.9 MHz. If my path length is 1000 km, the highest frequency I can use is 11.7 MHz. Now this is really useful. If I want to communicate from London to Stuttgart, a distance of approximately 800 km, of which Belgium is roughly half way (in the centre of the path) the highest frequency I could use, in this instance, is 10.2 MHz.
What is the lowest frequency I could use? That is more difficult. What the diagram does tell us, however, is that for short paths, (ie from Belgium to Belgium) the ionosphere was successfully refracting signals at frequencies as low as 3 MHz. How do we know this? There is a nice red/pink reflection on the chart at this frequency. Below it, the picture becomes rather scattered indicating that the refracted signal was not reliable.
So, what can we ascertain:
- The highest frequency being refracted by the ionosphere above Belgium is around 27.6 MHz. This is the highest frequency at which two stations separated by 3000 km for whom Belgium is in the centre of their path, will be able to communicate - the MUF.
- The highest frequency which can be used to communicate from one location to the same location (in Belgium) using the ionosphere is 7.15 MHz - foF2.
- For a range of distances, we can work out the maximum frequency which can be used.
- For short paths, we can find out the lowest possible frequency being refracted by the ionosphere (around 3 MHz in this case) and thus the lowest frequency which can be used.
 We can also take a stab at assessing how strongly the ionosphere is refracting. The phantom reflections shown at around 450 km height are signals which were refracted from the ionosphere, then reflected by the earth and then refracted again by the ionosphere. These phantom reflections would tend to suggest that the strength of refracted signals is particularly good, as it has been strong enough to rebound from the earth and refract again! Sometimes, three or even four phantoms can be seen, indicating very strong refractions which would suggest that short wave signals would be very strong.
The ionosondes in Europe include:
- Dourbes, Belgium
- Juliusruh, Germany
- Chilton, United Kingdom (registration is required but is free)
- Warsaw, Poland
- Rome, Italy
add comment
( 2202 views )
| permalink
| 

 ( 2.9 / 76703 )
( 2.9 / 76703 )